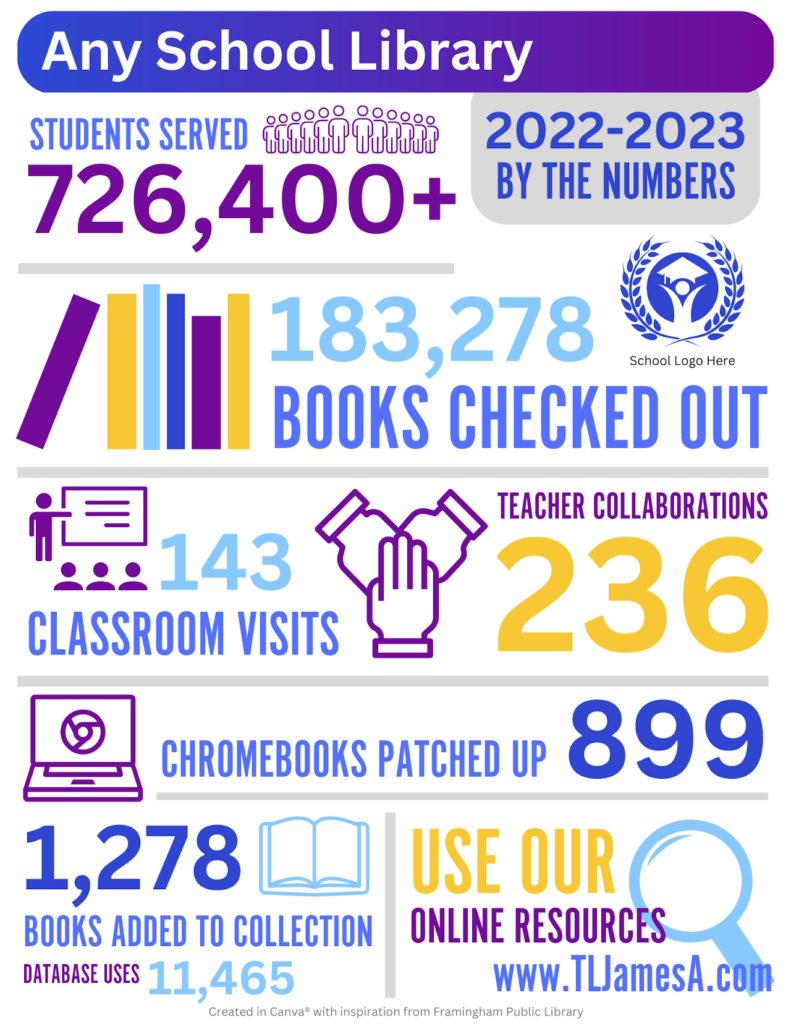
I saw a great question on a Facebook school library group. This person was wanting a template for an infographic similar to this one from the Framingham Public Library. I decided to refresh my memory on a few design tools so I recreated it in Canva, Genially, Adobe Express, Google Slides, PowerPoint, and Adobe Illustrator.
I listed some pros and cons for each tool and shared a template link so you can use it as you’d like. You can find those templates here, plus a fun prompt from ChatGPT on what items should be a school library infographic. Ashley Cooksey also shared a great post from Jennifer LaGarde on this crucial advocacy topic, “It’s Annual Report Season! Here Are Some Tips To Help You Effectively Tell Your Story.”
Next, I was thinking… “It would be awesome if there was a way to have a version of this that just automatically updates.” Looker Studio from Google is an option for this kind of data visualization. So I recreated the infographic in Looker Studio. Below is an example of an embed of that Looker Studio report. It pulls the numbers from a Google Sheet, which is updated through a simple Google Form. This form could be updated daily, weekly, monthly, or whenever. Looker Studio does all the work of keeping the totals going!
Looker Studio Embedded:
I created directions for the Looker Studio process here. Another option is to design your infographic in Canva or another program (without your stats), download that image, upload it to Looker Studio, and insert scorecards into the blanks! If you prefer video tutorials, I made one of those too.
Leave a Reply